


![]()

-
뉴스
-
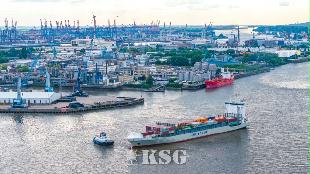
- Port of Hamburg Strengthens Partnership with China
- The Hamburg Port Authority (HPA) and SPG Qingdao Port Group signed a Port Partnership Agreement in Qingdao on 23 June. The agreement is designed to strengthen the relationship between the two ports and further intensify the exchange of expertise and best practices. Bot...
-
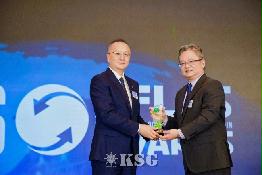
- Yang Ming Receives AFLAS Award for Best Sustainable...
- The Asian Freight, Logistics and Supply Chain Awards (AFLAS), organized by the renowned shipping publication Asia Cargo News, is one of the most prestigious honors in the global logistics and supply chain industry. In 2026, Yang Ming Marine Transport Corporation ("Yang...
-
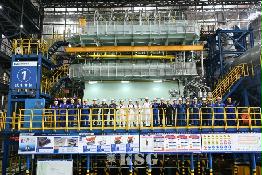
- WinGD Achieves next Ammonia Milestone with First X7...
- Swiss marine power company WinGD has achieved another critical milestone on the path to low-carbon shipping using ammonia as a marine fuel, with successful testing of its X72DF-A engine in China. The company has completed the Factory Acceptance Test on the engine, whic...
-
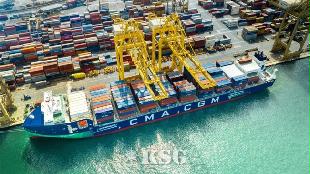
- CMA CGM Group Expands Into Aircraft Maintenance Wit...
- The CMA CGM Group, a global player in sea, land, air and logistics solutions, announces the signing of a preliminary agreement with a view to acquiring Crystal Aero Solutions, a company specialized in aircraft maintenance services for both cargo and passenger aircraft....
-
- 운항스케줄
-
오피니언


Canada, California ports grow west coast market share
North America West Coast container ports experienced a decline in year-over-year traffic in the second quarter of 2013.
Overall throughput to major west coast ports in the U.S., Mexico, and Canada fell 2.3% from 6,114,834 TEU in the second quarter of 2012 to 5,975,881 TEU in the second quarter of 2013. North America West Coast market shares of major Pacific Northwest and Mexican ports were down year-over-year. However, ports in Canada and California saw their shares of the market climb.
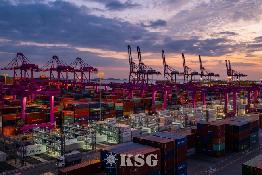
Among North America West Coast ports, U.S. ports continue to hold the largest market share, with an 81.6% share of overall traffic during the second quarter of 2013. This is up one-tenth of a percentage point from the same quarter a year ago. Of the major U.S. West Coast ports, Southern California, which includes the ports of Los Angeles and Long Beach, holds the highest overall market share with 60.1%. Southern California`s share went up by four-tenths of a percentage point from the previous year.
The major west coast Mexico Port of Lazaro Cardenas held a 4.5% share of the North America Pacific Coast market in the second quarter of 2013, a drop of six-tenths of a percentage point from a year ago. Canadian ports increased their share in the 2013 second quarter by four-tenths of a percentage point to a 13.8% share.
The major West Coast Canadian ports, which include Vancouver and Prince Rupert, British Columbia, saw throughput volume totaling 825,788 TEU in the second quarter of 2013, up 1.0% from 817,579 TEU in 2012.
Vancouver throughput rose 3.5% year-over-year to 696,917 TEU, and its market share inched up from 11.0% to 11.7%. However, Prince Rupert saw a decline in throughput of 10.7% this quarter to 128,871 TEU; its market share slipped from 2.4% to 2.2% year-over-year. Throughput at Lazaro Cardenas tumbled 14.0% year-over-year in the second quarter to 271,366 TEU.
Overall U.S. throughput was down year-over-year in the second quarter, falling 2.1% to 4,878,727 TEU. Tacoma saw the largest year-over-year jump in throughput in the second quarter, with volume up 34.3% to 346,823 TEU from 258,330 TEU in the second quarter of 2012, largely because of the Grand Alliance`s shift from Seattle to Tacoma. Its market share grew 1.6% points to 5.8%. < Korea Shipping Gazette >

선박운항스케줄
인기 스케줄
-
BUSAN
 UMM QASR
선박운항스케줄 목록 - 선박운항스케줄목록으로 Vessel, D-Date, A-Date, Agent를 나타내는 테이블입니다. Vessel D-Date A-Date Agent Gfs Galaxy 07/22 09/25 BEN LINE One Maestro 07/28 08/25 ESL Gfs Galaxy 07/28 08/25 ESL -
BUSAN
JEBEL ALI선박운항스케줄 목록 - 선박운항스케줄목록으로 Vessel, D-Date, A-Date, Agent를 나타내는 테이블입니다. Vessel D-Date A-Date Agent Gfs Galaxy 07/19 08/12 Tongjin Gfs Galaxy 07/19 08/12 Tongjin Gfs Galaxy 07/22 08/25 BEN LINE -
BUSAN
MUNDRA선박운항스케줄 목록 - 선박운항스케줄목록으로 Vessel, D-Date, A-Date, Agent를 나타내는 테이블입니다. Vessel D-Date A-Date Agent Esl Mundra 07/11 08/01 Doowoo Seaspan Brilliance 07/14 08/05 Sinokor Gsl Melita 07/17 08/05 BEN LINE -
PYEONGTAEK
BANGKOK선박운항스케줄 목록 - 선박운항스케줄목록으로 Vessel, D-Date, A-Date, Agent를 나타내는 테이블입니다. Vessel D-Date A-Date Agent Sawasdee Deneb 07/12 07/23 Sinokor Sawasdee Deneb 07/13 07/24 H.S. Line Dongjin Confident 07/13 07/25 Dongjin -
BUSAN
SOKHNA선박운항스케줄 목록 - 선박운항스케줄목록으로 Vessel, D-Date, A-Date, Agent를 나타내는 테이블입니다. Vessel D-Date A-Date Agent Wan Hai 308 07/19 08/25 Wan hai Ling Yun He 07/20 09/07 KWANHAE SHIPPING Gfs Galaxy 07/22 08/29 SOFAST KOREA
- 출발항
-
- 도착항
-


많이 본 기사
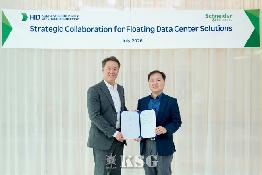
- 팬스타, 7월부터 한일항로 공동운항 참여…독자항로 철수BDI 2875포인트…벌크선 시장, 중대형선서 회복 드라이브서울권 민간 전문가들, 해사법원 활성화추진위 결성‘美동안 두자릿수 상승’ 컨운임지수 10주 연속↑건강칼럼/ 수족다한증, 단순한 땀이 아닌 치료가 필요한 질환삼성중공업, 연간 수주액 5년만에 100억弗 돌파해운조합, 저탄소 선박연료 공급망 인증 획득신간/ 김학소 교수 <해양강국 국가 대전략> 출간해진공 5기 청년이사회 출범…비효율 없애고 소통 활성화HD한국조선해양-슈나이더일렉트릭, 부유식 데이터센터 공동개발
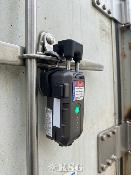
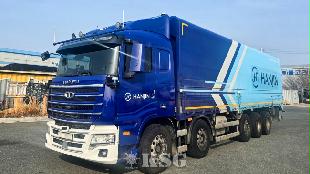
- LX판토스, ESG 관리 범위 해외사업장으로 확장부산항, 친환경 북극항로 거점 항만 도약 모색울산항만공사, 재난관리평가 2년 연속 우수기관 선정“화주와 함께 고민하는 물류서비스”맥스피드 “LCL 수출입 업무 디지털 전환”한진, 국내 최초 25t 자율주행 화물차 상업 운송 시작'수요증가 영향' 덴마크 머스크, 올해 실적 전망 상향조정에스위너스, 관세청에 컨테이너 전자봉인장치 공급IPA, 인천항 노후 상·하수관로 정밀조사…사업비 4억 투입팬스타그룹, 부산-오사카 크루즈 최대 50% 할인행사


해사물류 통계 ![]()


COPYRIGHTⓒ 2014 KOREA SHIPPING GAZETTE. ALL RIGHTS RESERVED.
COPYRIGHTⓒ 2015
KOREA SHIPPING GAZETTE. ALL RIGHTS RESERVED.
0/250
확인